Many decisions are made regarding both commercial and recreational fishing regulations, enhancement activities, and environmental policy based on salmon abundance estimates. But where do those numbers come from?
In a nutshell, they are a mix of what we see (measure, observe, or otherwise quantify) and what we extrapolate, or estimate, from what we see. While it obviously isn’t an exact science, it isn’t completely statistical voodoo either.

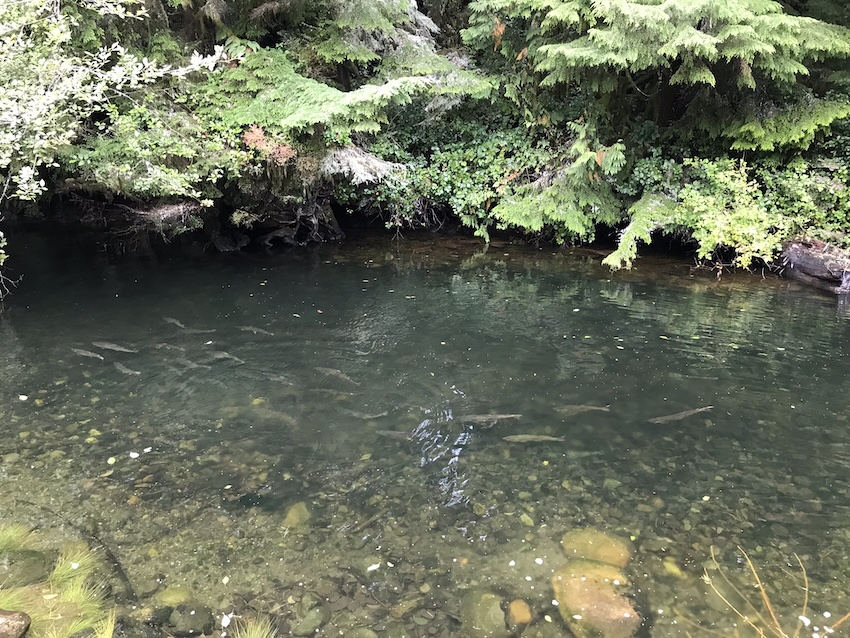
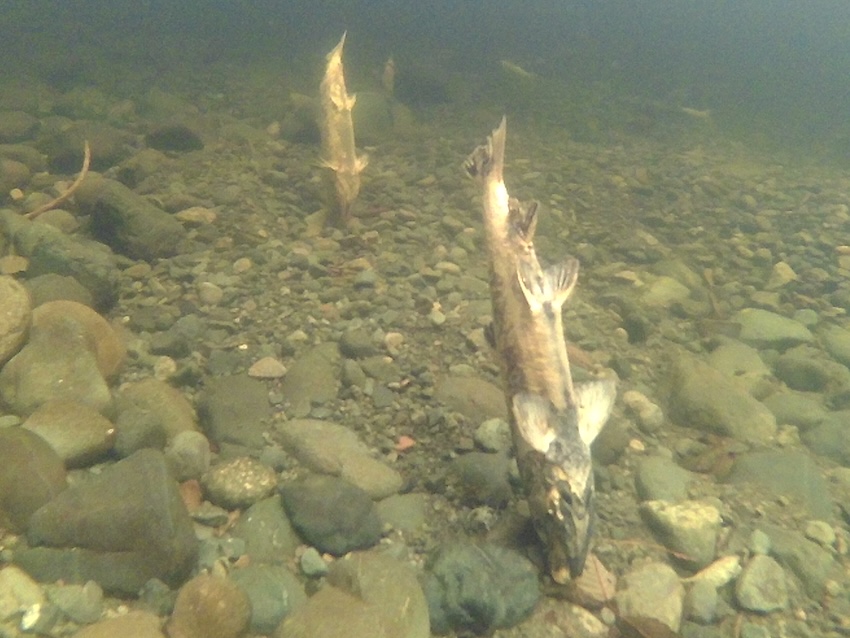
In-stream view – James Costello
Catch per Unit of Effort (CPU)
Part of the pre-season equation starts in the ocean with commercial test fisheries, which provide a “sample” of different runs passing through different areas. From these counts of actual returning fish caught and hydro-acoustic soundings, fisheries managers are able to estimate total run abundance using equations called “scalars” and based on Catch per Unit of Effort (CPU)—meaning there is a ratio of how many fish were caught, using what type of gear, and how long it took, versus where they fished and what type of fish they ended up catching.
Total Allowable Catch (TAC)
Where it really starts to get subjective and complicated is where the “confidence level” in these different values is decided upon. In the open ocean, things like historical data on actual catches as well as established knowledge regarding run timing and spatial distribution are employed to educate decision making regarding the Total Allowable Catch (TAC) to be employed for that season of fishing (TAC is a catch limit set for a fishery, generally for a fishing season).
In addition to the adult catch totals, we have the recruitment numbers, which are the estimated number of fish entering the ocean from freshwater every year. These numbers are based on a combination of hatchery and wild fish and again use a mix of hard data and estimates. While we feel we have a pretty good understanding of what a “normal” survival rate for salmon is in an average system, we also have to recognize that not all river systems are the same, and environmental factors vary from year to year. This is where it gets even more complicated, as fisheries managers must collect, compile, assess, and refine a massive amount of data from both enhancement facilities and a variety of freshwater enumeration efforts across the coast.
Counting spawning salmon returning to their natal streams is the most effective way to get an idea of population levels year to year, and these freshwater enumeration efforts are conducted in a number of different ways depending on the size of the system being surveyed.
Chum salmon in creek – James Costello photo
Passive Fish Counting Methods
Passive measures, where a stationary system is set up to count returning fish, come in a variety of sizes and technological levels for use in different areas and river types. The most basic setup used is a weir, or fence across the width of the river— as used on the Babine River (https://www.pac.dfo-mpo.gc.ca/fm-gp/northcoast-cotenord/babine-eng.html )—that directs fish into a trap where they can be manually counted. Although this can give a very accurate count by trapping all fish returning, the trap must be emptied regularly and the fence will accumulate debris and even spawned-out fish from upstream which must be removed to ensure the integrity of the apparatus.
A step up from the counting fence is the use of a fishway that directs fish into a counting tube where they can be observed and recorded using video to capture the entirety of the run passing through. This technology is used locally at the Stamp River Falls and is managed by the Hupacasath First Nations fisheries staff and has a live fish-tunnel view online where you can watch salmon in real time from the comfort of your own home.
Along with direct observation and physical capture of fish, a technology called Dual-Frequency Identification Sonar (DIDSON) can be utilized to survey larger rivers where other methods are not feasible due to either the level of flow or clarity of water in the system. This fixed location, side- looking, high-definition sonar system, such as the one used on the Nanaimo River, has the ability to identify individual salmon passing through the beam which can be counted manually by operators or by using a computer program to record marks and create a tally. While not as exact as either video or physical observation, these systems can minimize staff or volunteer time utilized in the monitoring of a run over an extended period of time.
Active Fish Counting Methods
Stream Inspection Log (SIL)
For many smaller creeks and rivers, a more low-tech and low-cost method is required, and a “bank walk” or “stream walk” method will be used – where crews will travel a specified length of a system either in the stream itself or on the sides of the channel counting both live and dead fish seen. For these types of surveys it is important to have clear, shallow water and navigable banks to facilitate accurate counts. Many times this combination does not occur and must be noted on the Stream Inspection Log (SIL) for later consideration.
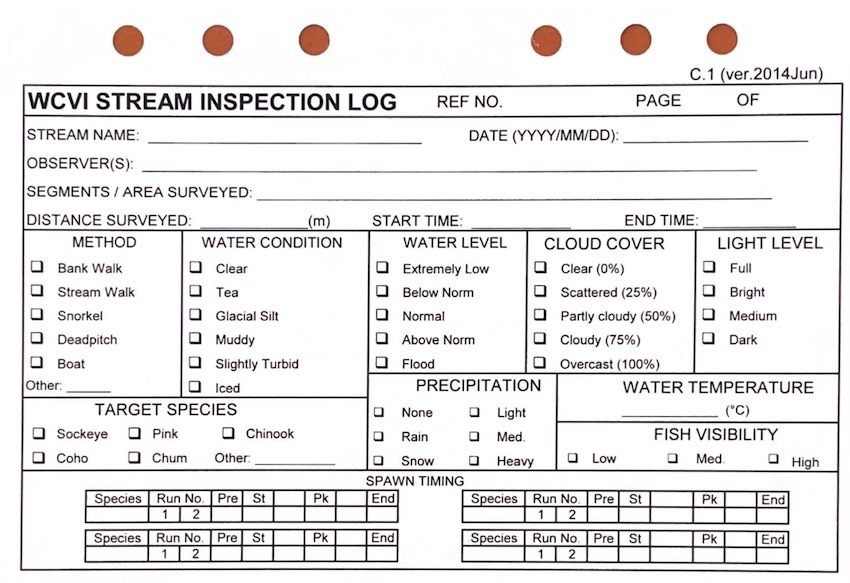
WCVI STREAM INSPECTION LOG
Deadpitch Survey
Fisheries scientists utilize a technique known as a “deadpitch” survey to estimate salmon populations. This method involves a thorough examination of deceased salmon carcasses within a specific river section. By analyzing the number and condition of these fish, researchers can gather valuable data on the size and health of the entire salmon run. Depending on the run timing, a “deadpitch” survey may be employed when no actively spawning fish are seen late in the season and only the carcasses of the salmon remain. In bigger systems or lakes, a boat can also be used to survey spawners from the surface, as is commonly done when counting beach- spawning sockeye salmon.
Dead chum – James Costello photo
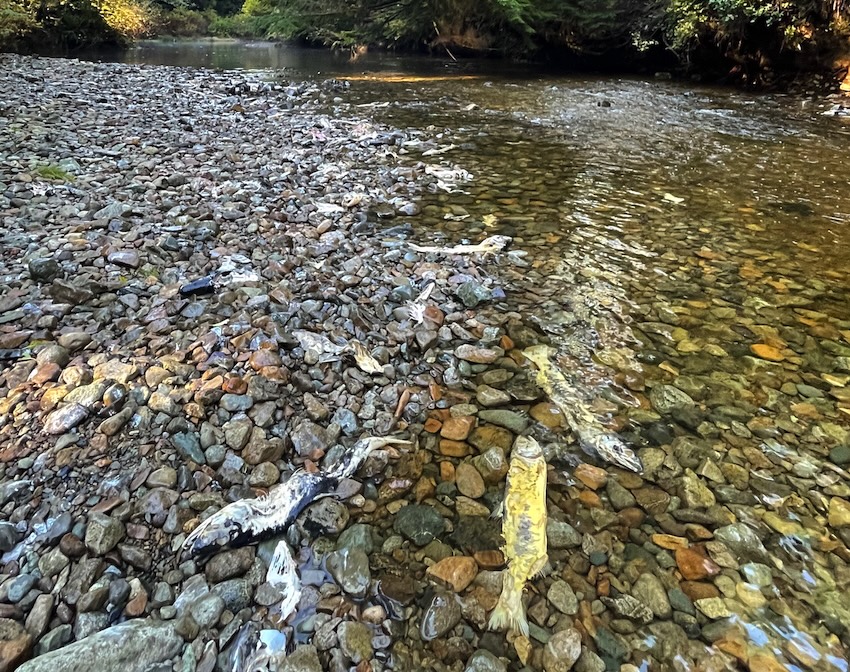
Deadpitch – James Costello photo
Snorkel Survey
For the most accurate count you sometimes have to get right in the river with the fish in what is called a “snorkel survey” and actively swim the length of a river, counting as you go. Pairs of swimmers will work their way downstream in a coordinated effort to observe as much of the habitat possible and record the totals of all species seen. Not only do you have to keep track of the numbers you’ve noted, but you also have to know what you’re looking at.
While this is challenging, it can often provide the most comprehensive picture of a salmon population at a given time. For all surveys, a detailed account of the distance surveyed (broken into individual segments) as well as time taken to assess, water level and condition, cloud cover, precipitation, and light level are recorded on the SIL in order to assist in taking the “snapshot” of the survey and extrapolating the total abundance of each species in the system, once again using different values and with varying confidence levels for each.
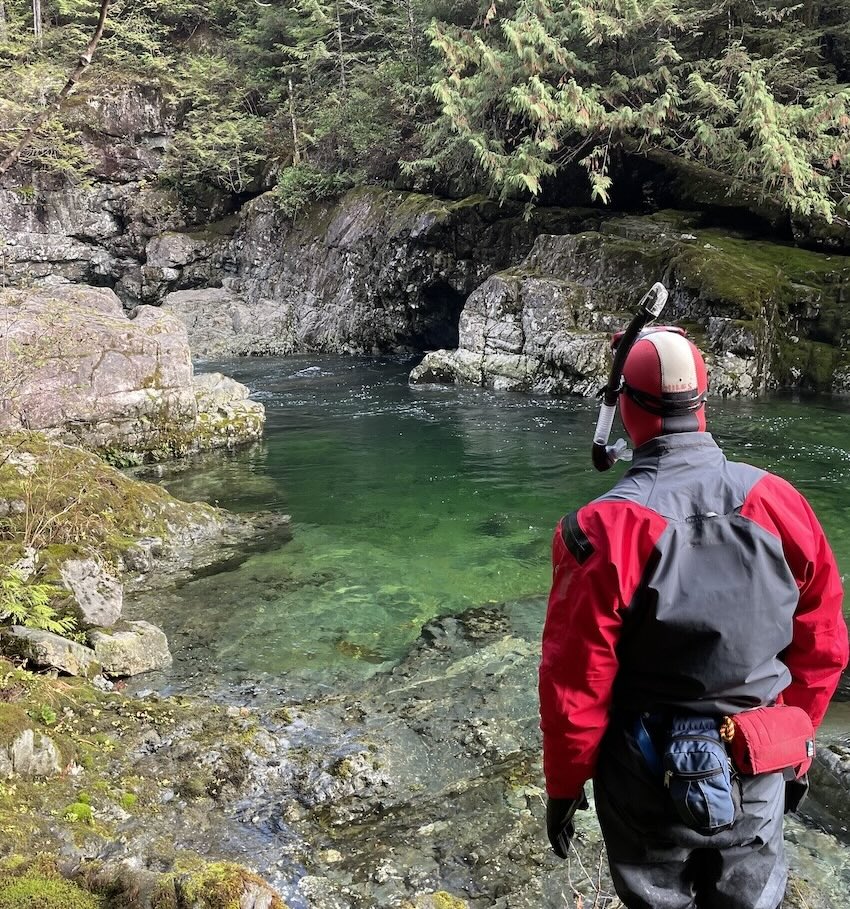
Preparing to swim – James Costello photo
The Bigger Picture
Because salmon return to spawn over a period of time, individual surveys only capture the fish totals seen that day and don’t show the whole picture. Multiple surveys are conducted throughout the season to provide the best data possible, aiming to identify when the start of the run occurs, when it peaks, and when it ends.
In addition to physical factors such as visibility, estimated total of the habitat seen, and even the experience level of the surveyors themselves, fisheries managers have to also account for differences in spawn timing and how long each fish might have been in the river, known as “residence time.” Because surveyors may encounter the same fish multiple times on different dates, this critical piece of information is extrapolated from data captured on the SIL by surveyors, noting the number of fish that appear “new” (i.e., still bright silver or not marked up from test digging), the number of fish that are paired on redds or actively spawning, and an estimated overall reliability for all metrics recorded.
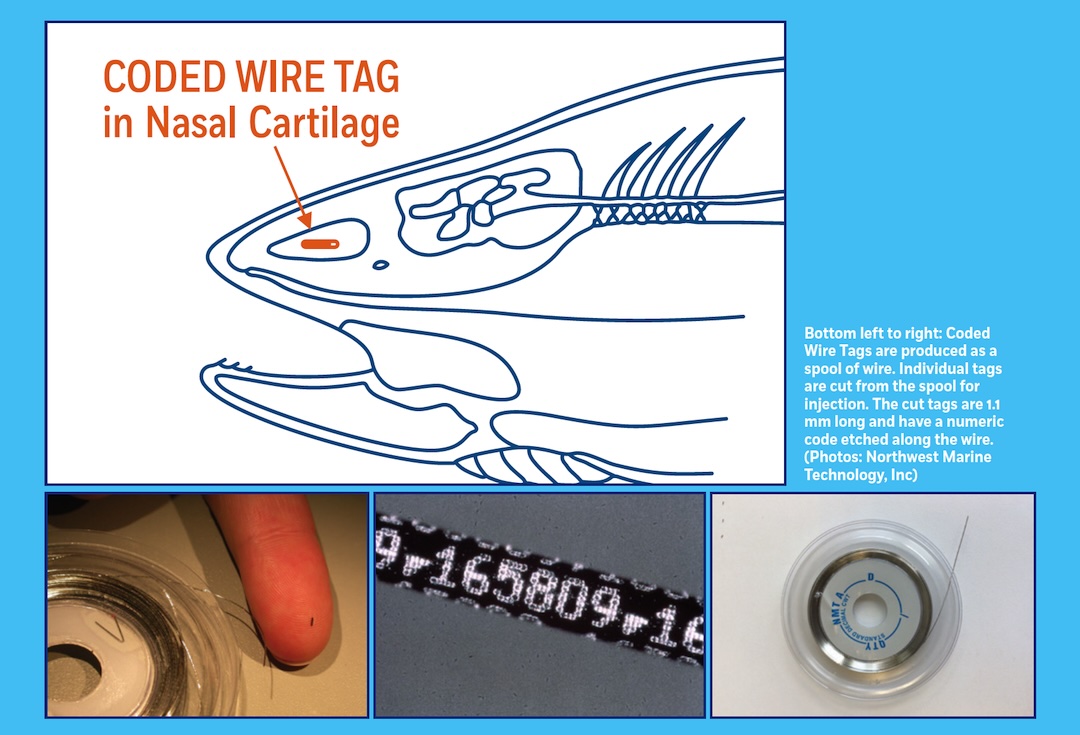
Coded-Wire Tags (CWT)
Another aspect of run monitoring is the use of coded-wire tags implanted into the heads of hatchery fish, which will then be marked by “clipping” the adipose fin for a visual cue of their origin at the time of capture. These tags contain a barcode linked back to a database of releases, showing the origin and size of the fish at the time “it was set loose into the wild, and will provide a variety of information regarding survival, growth rates, and migration patterns.
A “CWT tag” refers to a “Coded Wire Tag,” a small piece of coded stainless steel wire typically inserted into the snout of a fish, requiring physical dissection to read its unique code when the fish is caught, while a “PIT tag” stands for Passive Integrated Transponder, which is an electronic tag that can be read by a scanner when it passes close by. Essentially, a PIT tag is an electronic identification system while a CWT tag is a physical, coded tag that needs to be retrieved and examined to identify the fish.
As you can see, any survey includes much more than just the numbers of fish seen, and by using all of these additional pieces of information fisheries managers are able to assemble a high-level estimate of total run abundance over the spawning season. Part observation, part extrapolation, these estimates are only made possible by the efforts of dedicated staff and volunteers who routinely brave the elements every season to collect the needed data.
Please contact your local hatchery for more information on how this data is collected and how you can get involved in monitoring the runs in your area.
This article appeared in Island Fisherman magazine. Never miss another issue—subscribe today!
Visit the Store
$34.99

$34.99


Featured Catch

Joel Unickow halibut (Photo: Rob Frawley Lucky Strike Sportfishing Tofino)